System and Process Modeling
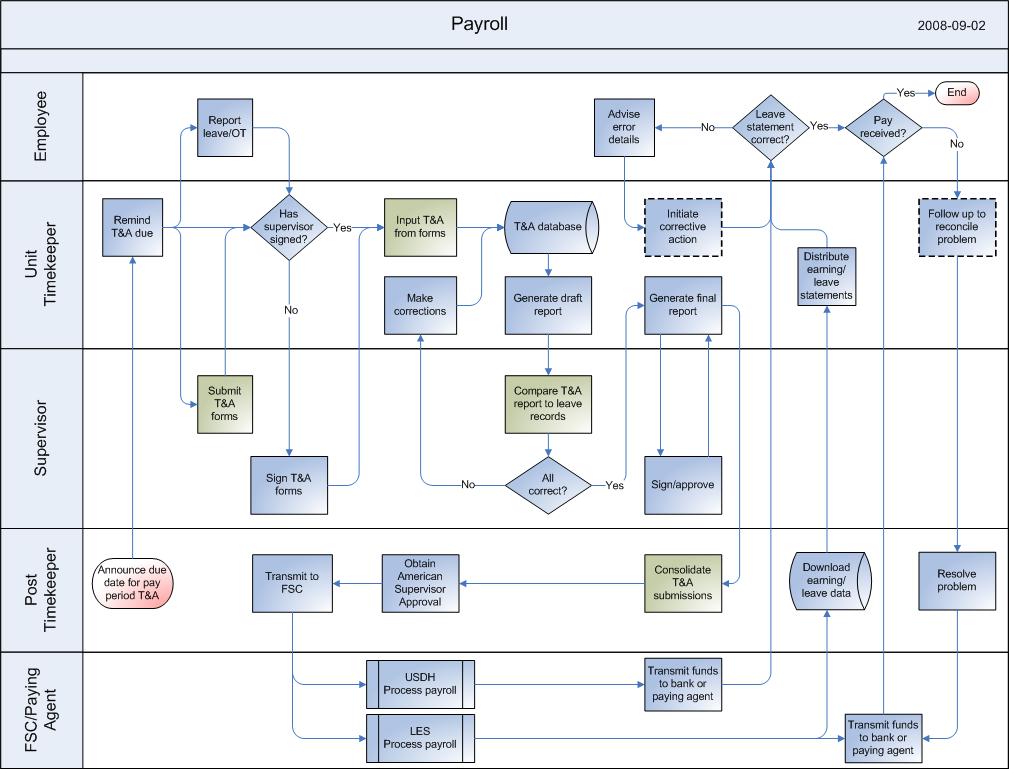
Modeling Processes is the first step in identifying redundant tasks, standardizing steps to take, and opportunities for process improvement and data collection. The visualization to the right is a sample map of the payroll process taken from wiki commons.
|
|
Graph/Network Analysis
Graph Analysis looks at a network to determine interesting features such as communities/cliques, connectedness, bridges between cliques, etc. The visualization to the right is based on the "le miserables" movie and click here for the interactive version.
Each node is a character and each link is a scene the characters were in together. A few characters were removed to allow the network to be spread out more so the links and characters can be clearly seen. The size of the node represents it betweenness centrality, that is how import that particular node is in connecting other nodes to each other. |
|
Text Analysis and Natural Language Processing
Text analysis and natural language processing allows for extracting key topics, actions, attributes, words, phrases, etc from text. This includes sentiment analysis which is determining the emotion or attitude behind a given text .
The visualization to the right shows then dependencies within the sentence "Rick, the red dog, waited for hours to run around the small dog of the corn, before the midnight heat in arizona.". Hover over the purple words to show their parts-of-speech. This type of information and visualization can be used to automatically extract subject, verb, object relations and other conceptual relationships of interest. |
|
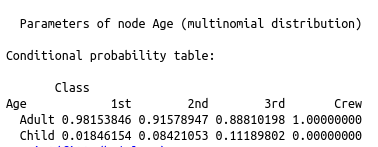
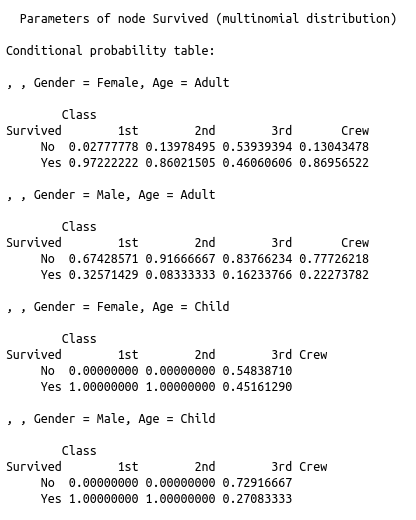
Multivariate Distributions and Analysis
Finding the distribution of multiple variables allows you to understand which factors are independent of each other and what sets of variable are likely to occur or not occur together.
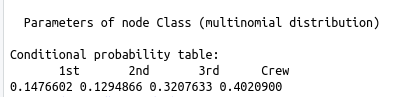
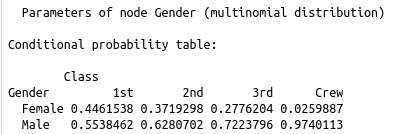
The visualization to the right is based on the Titanic demographic data on who did and did not survive. The top image is a compact way to show what factors influence (as shown by the arrow towards) other factors. This can be queried to get certain probabilities of an event happening given certain information. An example would be finding out how likely someone will survive if they are a male vs how likely they will survive if they are female and a child. The tables below the network show how the probabilities changed given certain factors, the event or attribute being predicted is on the left side of each row. |
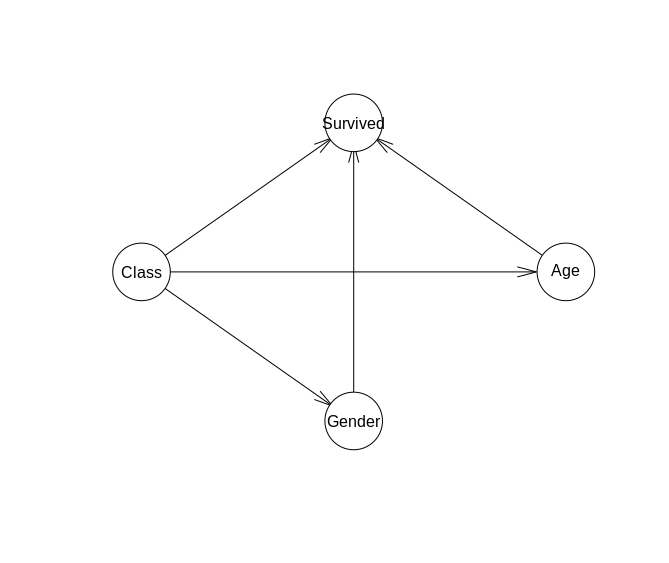
Conditional Network of Titanic Demographics
|
Predictive and Prescriptive Modeling
Here I analyze the factors related to your bottom-line to determine how they influence it . That model is then tested against new data for validation.
This example discovers the variables of the equation at the top of the right image based on the inputs and outputs of that formula. The plot shows how well the model fits that data and where the model predicts the next values will go as X increases. These types of methods are useful for predicting things like seasonal demand, system failures, click rate, likelihood of subscription, power consumption, and more. |
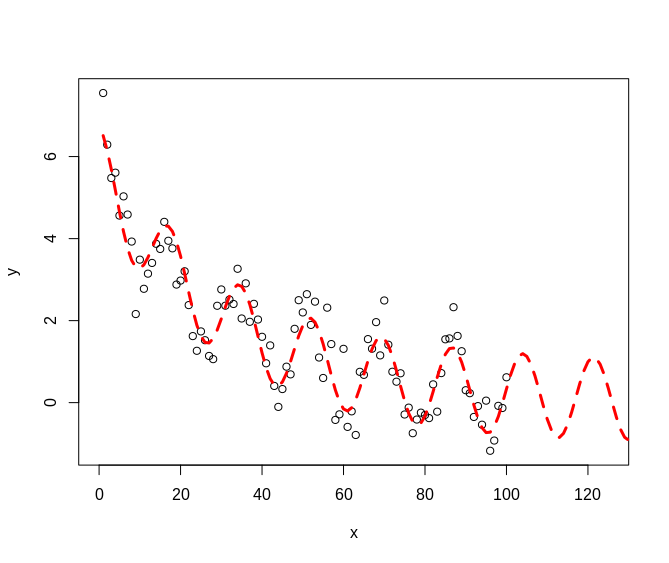
Plot of the data and the line predicting where the data points will fall
|
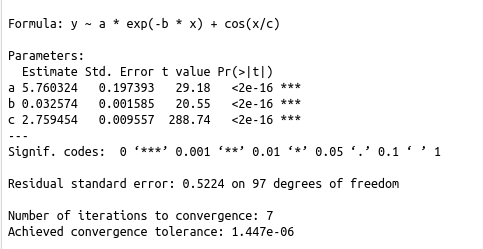
Final Fit and Confidence
|
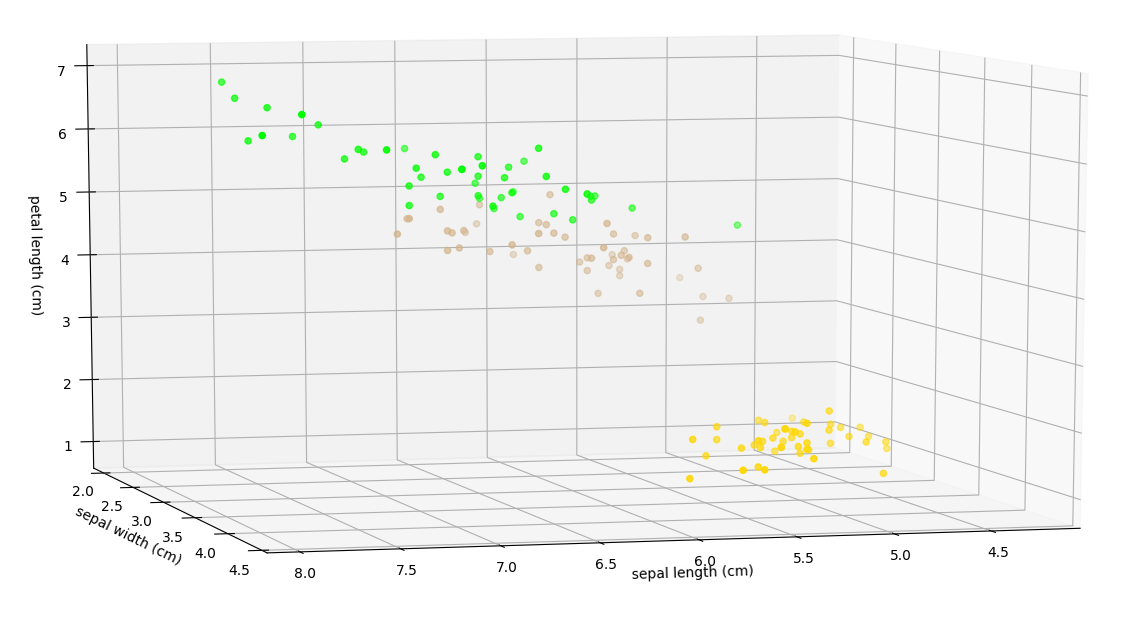
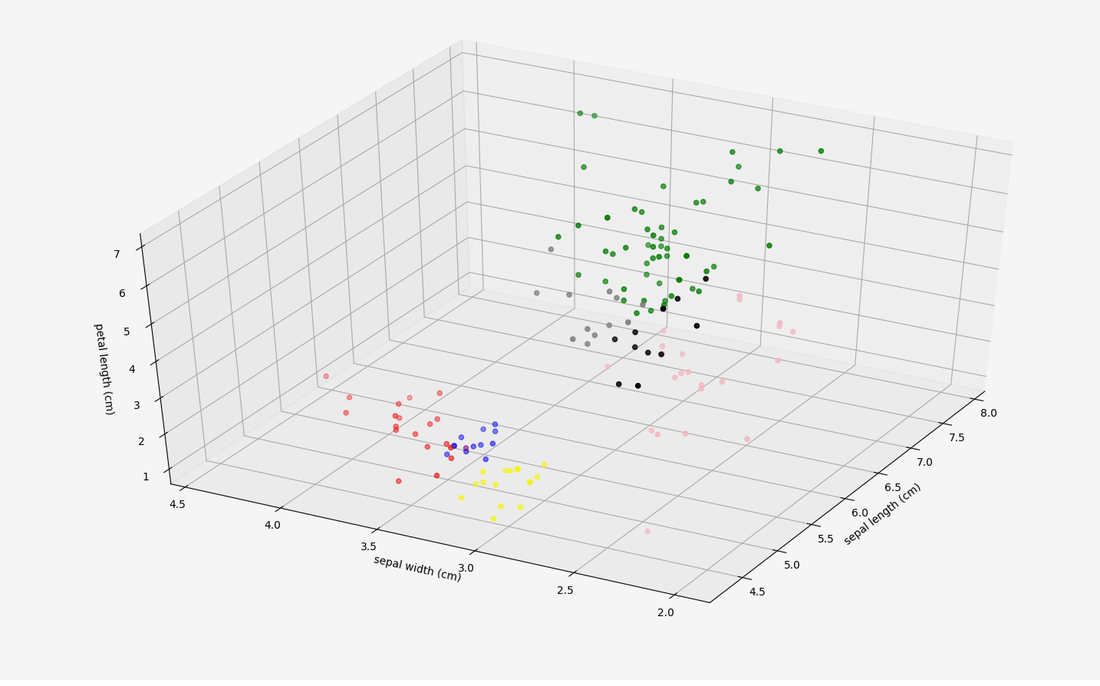
Unsupervised Learning
Even the little ducky by the These techniques are useful for automatic customer segmentation, up-selling and trend detection (just to name a few).
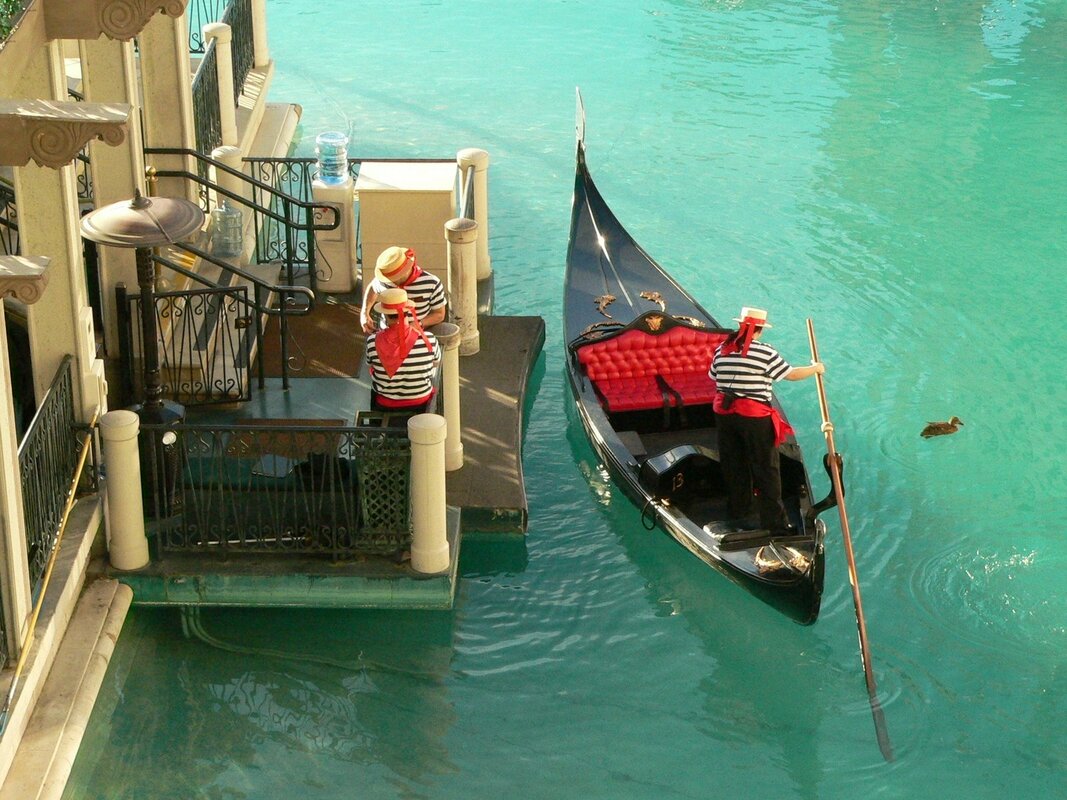
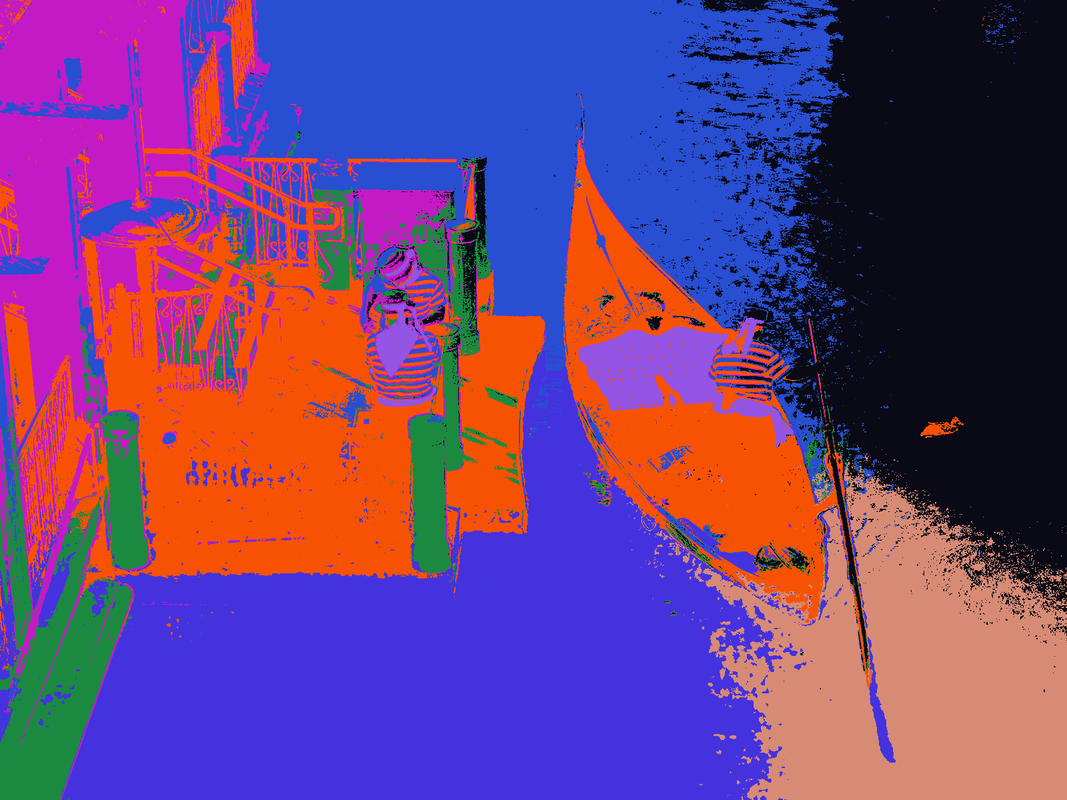
The example to the right clusters the iris dataset (which is a dataset of measurements taken of plant characteristics for three types of flowers) into groups that can be useful in predictive and association analysis since many of these clusters belong only to one type of plant, or at least disproportionately to one type. Click here to enlarge the 3D Labeled Iris Plot or the 3D Clustered Iris Plot. The image on the bottom left was clustered and the pixels that were assigned to each cluster are given a random color to identify which cluster its in. Look closely and you can see the boat, the people, the building and the building's shadow are all captured. Even the little ducky by the boat has its captured. |
|
Computer Vision
Computer vision is using computers to automatically classify and extract features from images or videos. This is used in object detection, eye tracking and facial recognition.
The examples to the right are videos that were analyzed to find over 70 generic types of 'objects' . The computer can be taught to learn from more specific and diverse types of images such as car/truck, plates/spoons/forks, etc. for increasing quality but for these basic examples generic objects were used. The videos to the right shows were the computer detected the object with a box containing the label of what the computer thinks it has found. These videos were collected from pixabay. |
|
|
Current Events:
Contact Form
Open Hours:
Contact to setup an appointment
|
Location:
At Client Site
Atlanta, GA |
Email:
|